[2025] Cumulative installed capacity of Wind Power in Japan : 6,434.2MW (2,866 units)
2026/02/18
- Reports
Cumulative Installed Wind Power Capacity in Japan
as of December 2025 -6,434.2MW (2,866 turbines)-
*Figures may change due to confirmation of construction and decommissioning dates, etc.
▼Summary of Annual Results
|
2025 |
Cumulative capacity=6,434.2MW、2,866 turbines |
|
Annual installation (Gross)=24 windfarms、625.0MW、171 turbines Annual installation(Net) =18 windfarms、595.5MW、148 turbines Annual decommissioning = 6 windfarms、 29.5MW、 23 turbines |
*Gross : Newly installed capacity Net : Net increase after deducting decommissioned capacity
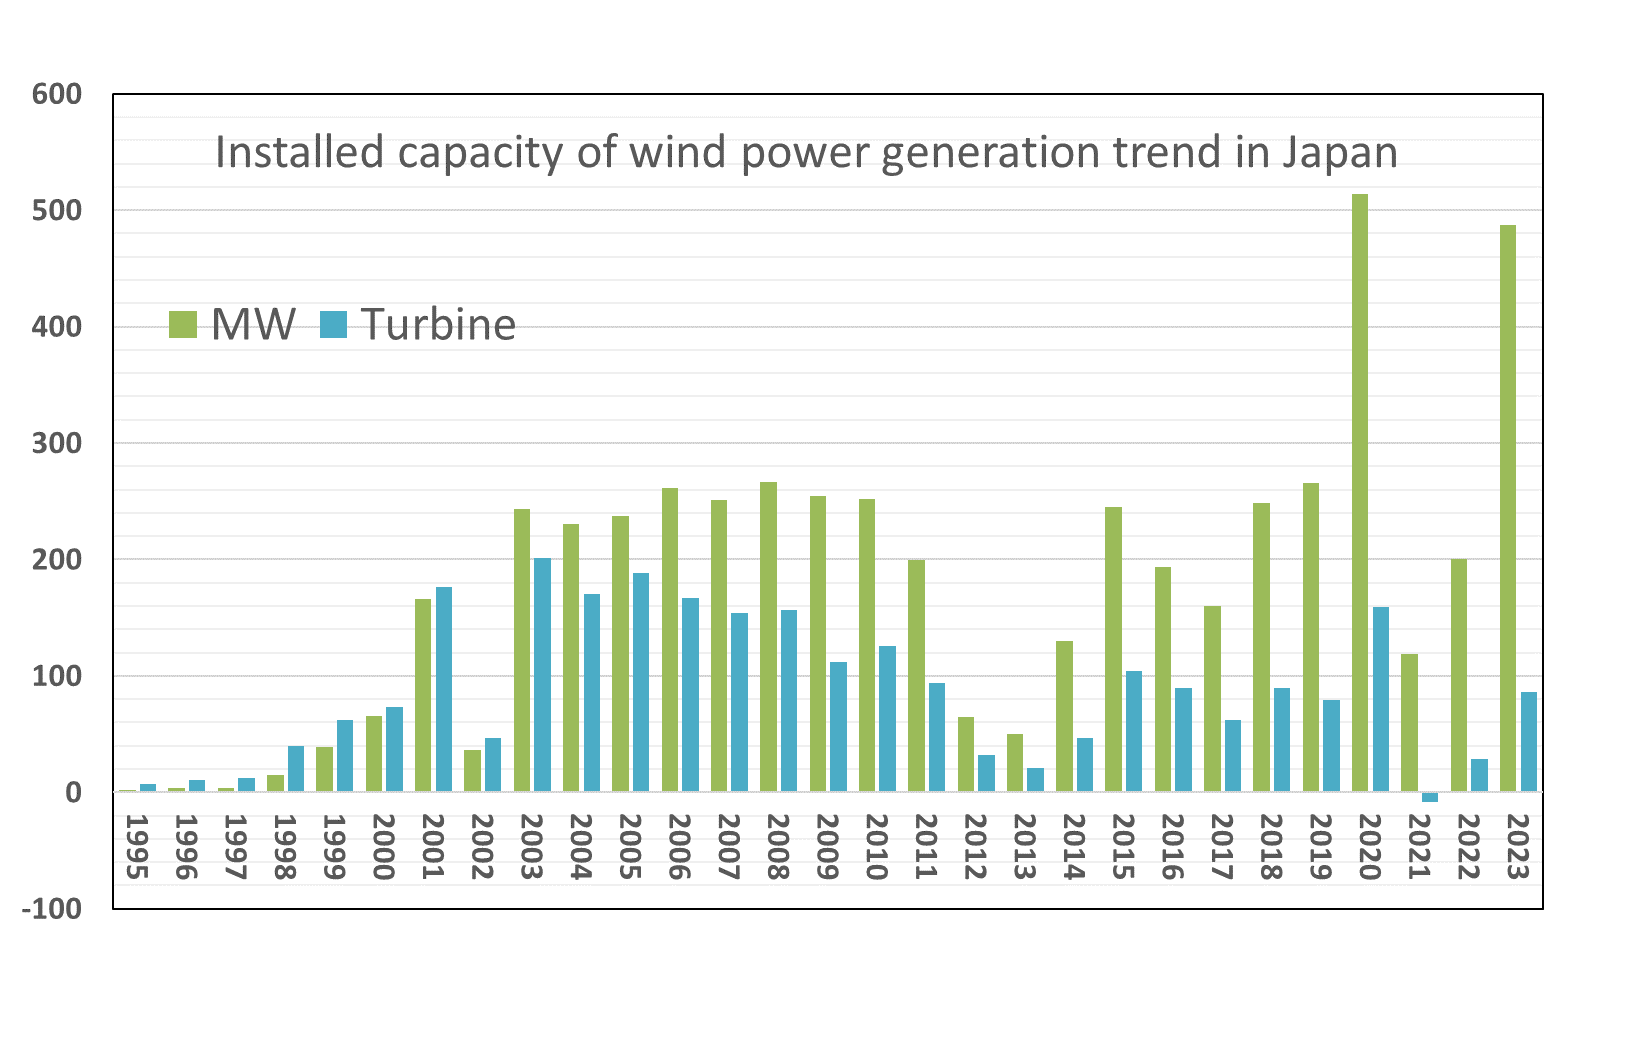
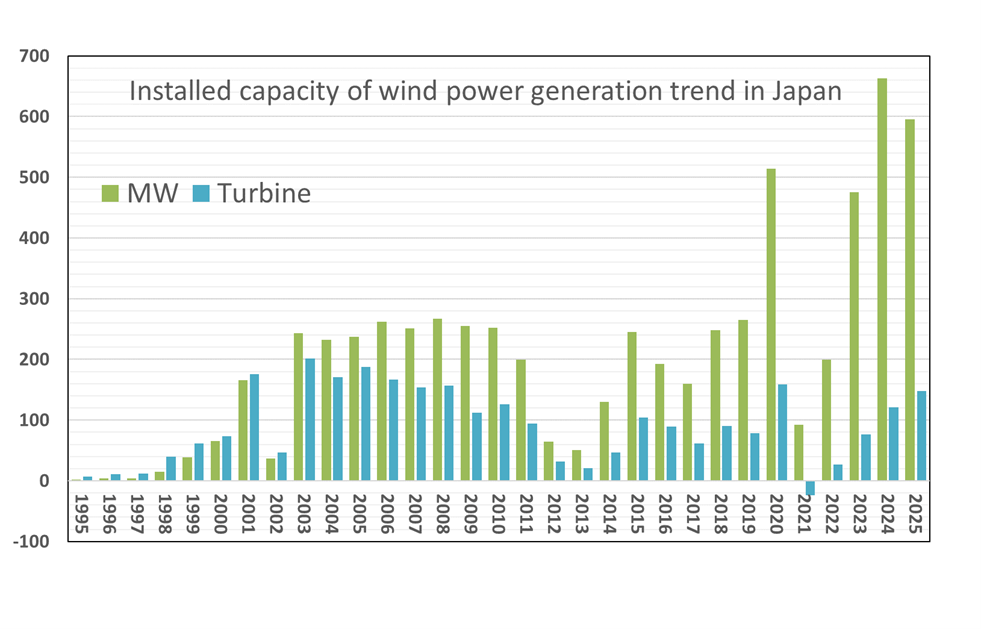
The Japan Wind Power Association (JWPA) has compiled preliminary figures for wind power installations in Japan as of the end of December 2025.
In 2025, newly installed capacity (gross) totaled 625.0 MW (171 turbines) across 24 sites nationwide. After accounting for decommissioned sites, the net increase amounted to 595.5 MW (148 turbines) across 18 sites, bringing Japan’s cumulative installed wind power capacity to 6,434.2 MW (2,866 turbines).
Although no new offshore wind projects commenced commercial operation in 2025, onshore wind deployment continued to advance. Notably, Japan’s largest onshore wind farm, with a capacity of 147.2 MW, was commissioned in Fukushima Prefecture. As a result, Fukushima ranked first nationwide in terms of newly installed capacity by prefecture in 2025.
In terms of cumulative installed capacity, Hokkaido maintained its position as Japan’s leading prefecture for the second consecutive year.
(1) Cumulative Installed Capacity by Prefecture
|
Rank |
Prefecture |
Capacity (MW) |
|
1 |
Hokkaido |
1,281 |
|
2 |
Aomori |
962 |
|
3 |
Akita |
913 |
|
4 |
Fukushima |
544 |
|
5 |
Iwate |
267 |
(2) New Installed Capacity by Prefecture
|
Rank |
Prefecture |
Capacity (MW) |
|
1 |
Fukushima |
274 |
|
2 |
Hokkaido |
143 |
|
3 |
Akita |
115 |
Note: Past installation figures may be subject to revision after publication due to the subsequent identification of decommissioning or corrections to commercial operation dates.
For annual installation trends since 2010, prefectural installed capacity as of the end of December 2025, and graphs showing trends in average turbine capacity, please refer to the link below.
===> dounyuujisseki2025graph_hp_en